Most ebook files are in PDF format, so you can easily read them using various software such as Foxit Reader or directly on the Google Chrome browser.
Some ebook files are released by publishers in other formats such as .awz, .mobi, .epub, .fb2, etc. You may need to install specific software to read these formats on mobile/PC, such as Calibre.
Please read the tutorial at this link: https://ebookbell.com/faq
We offer FREE conversion to the popular formats you request; however, this may take some time. Therefore, right after payment, please email us, and we will try to provide the service as quickly as possible.
For some exceptional file formats or broken links (if any), please refrain from opening any disputes. Instead, email us first, and we will try to assist within a maximum of 6 hours.
EbookBell Team
0.0
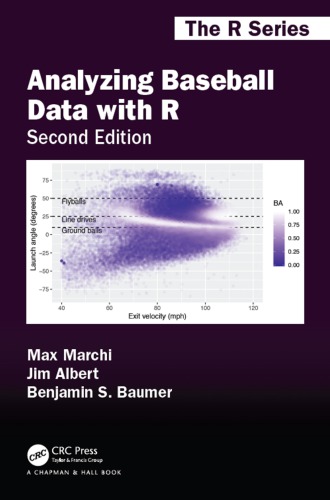
0 reviewsAnalyzing Baseball Data with R Second Edition introduces R to sabermetricians, baseball enthusiasts, and students interested in exploring the richness of baseball data. It equips you with the necessary skills and software tools to perform all the analysis steps, from importing the data to transforming them into an appropriate format to visualizing the data via graphs to performing a statistical analysis.
The authors first present an overview of publicly available baseball datasets and a gentle introduction to the type of data structures and exploratory and data management capabilities of R. They also cover the ggplot2 graphics functions and employ a tidyverse-friendly workflow throughout. Much of the book illustrates the use of R through popular sabermetrics topics, including the Pythagorean formula, runs expectancy, catcher framing, career trajectories, simulation of games and seasons, patterns of streaky behavior of players, and launch angles and exit velocities. All the datasets and R code used in the text are available online.
New to the second edition are a systematic adoption of the tidyverse and incorporation of Statcast player tracking data (made available by Baseball Savant). All code from the first edition has been revised according to the principles of the tidyverse. Tidyverse packages, including dplyr, ggplot2, tidyr, purrr, and broom are emphasized throughout the book. Two entirely new chapters are made possible by the availability of Statcast data: one explores the notion of catcher framing ability, and the other uses launch angle and exit velocity to estimate the probability of a home run. Through the book’s various examples, you will learn about modern sabermetrics and how to conduct your own baseball analyses.