logo

EbookBell.com

Most ebook files are in PDF format, so you can easily read them using various software such as Foxit Reader or directly on the Google Chrome browser.
Some ebook files are released by publishers in other formats such as .awz, .mobi, .epub, .fb2, etc. You may need to install specific software to read these formats on mobile/PC, such as Calibre.

Please read the tutorial at this link:  https://ebookbell.com/faq 


We offer FREE conversion to the popular formats you request; however, this may take some time. Therefore, right after payment, please email us, and we will try to provide the service as quickly as possible.


For some exceptional file formats or broken links (if any), please refrain from opening any disputes. Instead, email us first, and we will try to assist within a maximum of 6 hours.

EbookBell Team
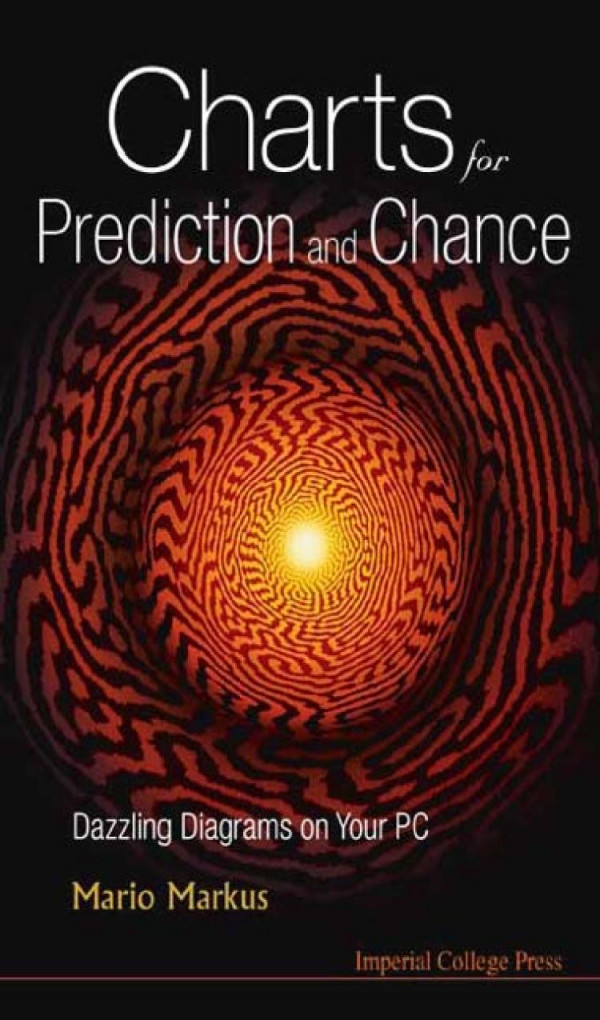
Charts For Prediction And Chance Dazzling Diagrams On Your Pc 1st Edition Mario Markus

  • SKU: BELL-1639144
Charts For Prediction And Chance Dazzling Diagrams On Your Pc 1st Edition Mario Markus
$ 31.00 $ 45.00 (-31%)

4.0

76 reviews

Charts For Prediction And Chance Dazzling Diagrams On Your Pc 1st Edition Mario Markus instant download after payment.

Publisher: Imperial College Press
File Extension: PDF
File size: 26.5 MB
Pages: 287
Author: Mario Markus
ISBN: 978-1-86094-835-0 (Hardcover), 1-86094-835-9 (Hardcover), 978-1-86094-835-0 (HARDCOVER), 1-86094-835-9 (HARDCOVER)
Language: English
Year: 2008
Edition: 1

Product desciption

Charts For Prediction And Chance Dazzling Diagrams On Your Pc 1st Edition Mario Markus by Mario Markus 978-1-86094-835-0 (Hardcover), 1-86094-835-9 (Hardcover), 978-1-86094-835-0 (HARDCOVER), 1-86094-835-9 (HARDCOVER) instant download after payment.

This innovative book brings together two disciplines science and art and enables readers to produce their own computer-generated displays. 44 colour plates and 200 black and white pictures showcase the diagrams that can easily be reproduced using the accompanying CD-ROM. It is possible to create diagrams that indicate predictability or unpredictability of physical, chemical, ecological, mathematical or economic systems. Grey levels and colours indicate the stability of a predictable system, or the extent of unpredictability. In addition, diagrams can be drawn purely for their aesthetic value. Directed both at scientists and laymen, technicians and artists, this combination of book and CD-ROM is the first of its kind.

Related Products