logo

EbookBell.com

Most ebook files are in PDF format, so you can easily read them using various software such as Foxit Reader or directly on the Google Chrome browser.
Some ebook files are released by publishers in other formats such as .awz, .mobi, .epub, .fb2, etc. You may need to install specific software to read these formats on mobile/PC, such as Calibre.

Please read the tutorial at this link:  https://ebookbell.com/faq 


We offer FREE conversion to the popular formats you request; however, this may take some time. Therefore, right after payment, please email us, and we will try to provide the service as quickly as possible.


For some exceptional file formats or broken links (if any), please refrain from opening any disputes. Instead, email us first, and we will try to assist within a maximum of 6 hours.

EbookBell Team
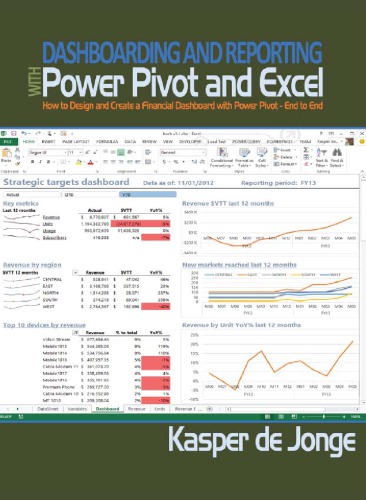
Dashboarding And Reporting With Power Pivot And Excel How To Design And Create A Financial Dashboard With Powerpivot End To End Jonge

  • SKU: BELL-21984206
Dashboarding And Reporting With Power Pivot And Excel How To Design And Create A Financial Dashboard With Powerpivot End To End Jonge
$ 31.00 $ 45.00 (-31%)

4.3

8 reviews

Dashboarding And Reporting With Power Pivot And Excel How To Design And Create A Financial Dashboard With Powerpivot End To End Jonge instant download after payment.

Publisher: Holy Macro! Books
File Extension: PDF
File size: 6.44 MB
Pages: 175
Author: Jonge, Kasper de
ISBN: 9781615470273, 9781615471188, 9781615472185, 9781615473397, 1615470271, 1615471189, 1615472185, 1615473394
Language: English
Year: 2014

Product desciption

Dashboarding And Reporting With Power Pivot And Excel How To Design And Create A Financial Dashboard With Powerpivot End To End Jonge by Jonge, Kasper De 9781615470273, 9781615471188, 9781615472185, 9781615473397, 1615470271, 1615471189, 1615472185, 1615473394 instant download after payment.

Microsoft’s revolutionary Power Pivot is a tool that allows users to create and transform data into reports and dashboards in new and much more powerful ways using the most-used analytical tool in the world: Excel.
This book, written by a member of Microsoft’s Power Pivot team, provides a practical step by step guide on creating a financial dashboard. The book covers in detail how to combine and shape the relevant data, build the dashboard in Excel, providing layout and design tips and tricks, prepare the model to work with fiscal dates, and show values used in many financial reports, including year-to-date, variance-to-target, percentage-of-total, and running totals reports.
Accessibly written, this book offers readers a practical, real-world scenario and can be used as a day-to-day reference. Though the guide focuses on Power Pivot for Excel 2010, a chapter that discusses Power View—compatible with Excel 2013— and Power BI is also included.

Related Products