logo

EbookBell.com

Most ebook files are in PDF format, so you can easily read them using various software such as Foxit Reader or directly on the Google Chrome browser.
Some ebook files are released by publishers in other formats such as .awz, .mobi, .epub, .fb2, etc. You may need to install specific software to read these formats on mobile/PC, such as Calibre.

Please read the tutorial at this link:  https://ebookbell.com/faq 


We offer FREE conversion to the popular formats you request; however, this may take some time. Therefore, right after payment, please email us, and we will try to provide the service as quickly as possible.


For some exceptional file formats or broken links (if any), please refrain from opening any disputes. Instead, email us first, and we will try to assist within a maximum of 6 hours.

EbookBell Team
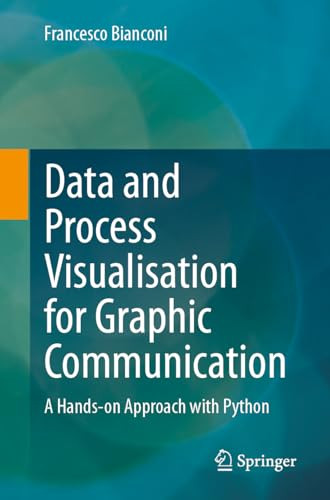
Data And Process Visualisation For Graphic Communication A Handson Approach With Python 1st Edition Francesco Bianconi

  • SKU: BELL-57213600
Data And Process Visualisation For Graphic Communication A Handson Approach With Python 1st Edition Francesco Bianconi
$ 31.00 $ 45.00 (-31%)

0.0

0 reviews

Data And Process Visualisation For Graphic Communication A Handson Approach With Python 1st Edition Francesco Bianconi instant download after payment.

Publisher: Springer
File Extension: PDF
File size: 20.05 MB
Pages: 261
Author: Francesco Bianconi
ISBN: 9783031570506, 3031570502
Language: English
Year: 2024
Edition: 1

Product desciption

Data And Process Visualisation For Graphic Communication A Handson Approach With Python 1st Edition Francesco Bianconi by Francesco Bianconi 9783031570506, 3031570502 instant download after payment.

This book guides the reader through the process of graphic communication with a particular focus on representing data and processes. It considers a variety of common graphic communication scenarios among those that arise most frequently in practical applications. The book is organized in two parts: representing data (Part I) and representing processes (Part II). The first part deals with the graphical representation of data. It starts with an introductory chapter on the types of variables, then guides the reader through the most common data visualization scenarios – i.e.: representing magnitudes, proportions, one variable as a function of the other, groups, relations, bivariate, trivariate and geospatial data. The second part covers various tools for the visual representation of processes; these include timelines, flow-charts, Gantt charts and PERT diagrams. In addition, the book also features four appendices which cover cross-chapter topics: mathematics and statistics review, Matplotlib primer, color representation and usage, and representation of geospatial data. Aimed at junior and senior undergraduate students in various technical, scientific, and economic fields, this book is also a valuable aid for researchers and practitioners in data science, marketing, entertainment, media and other fields.

Related Products