logo

EbookBell.com

Most ebook files are in PDF format, so you can easily read them using various software such as Foxit Reader or directly on the Google Chrome browser.
Some ebook files are released by publishers in other formats such as .awz, .mobi, .epub, .fb2, etc. You may need to install specific software to read these formats on mobile/PC, such as Calibre.

Please read the tutorial at this link:  https://ebookbell.com/faq 


We offer FREE conversion to the popular formats you request; however, this may take some time. Therefore, right after payment, please email us, and we will try to provide the service as quickly as possible.


For some exceptional file formats or broken links (if any), please refrain from opening any disputes. Instead, email us first, and we will try to assist within a maximum of 6 hours.

EbookBell Team
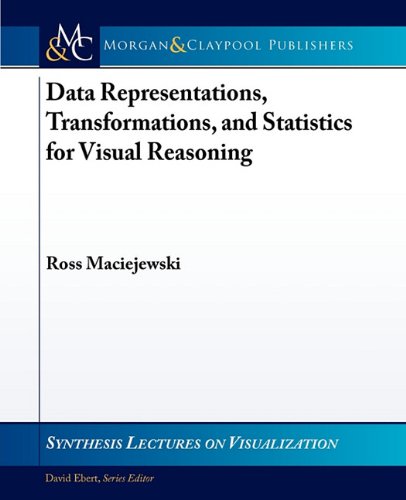
Data Representations Transformations And Statistics For Visual Reasoning 1st Edition Ross Maciejewski

  • SKU: BELL-2393674
Data Representations Transformations And Statistics For Visual Reasoning 1st Edition Ross Maciejewski
$ 31.00 $ 45.00 (-31%)

4.7

46 reviews

Data Representations Transformations And Statistics For Visual Reasoning 1st Edition Ross Maciejewski instant download after payment.

Publisher: Morgan & Claypool Publishers
File Extension: PDF
File size: 1.75 MB
Pages: 87
Author: Ross Maciejewski
ISBN: 1608456250
Language: English
Year: 2011
Edition: 1

Product desciption

Data Representations Transformations And Statistics For Visual Reasoning 1st Edition Ross Maciejewski by Ross Maciejewski 1608456250 instant download after payment.

Analytical reasoning techniques are methods by which users explore their data to obtain insight and knowledge that can directly support situational awareness and decision making. Recently, the analytical reasoning process has been augmented through the use of interactive visual representations and tools which utilize cognitive, design and perceptual principles. These tools are commonly referred to as visual analytics tools, and the underlying methods and principles have roots in a variety of disciplines. This chapter provides an introduction to young researchers as an overview of common visual representations and statistical analysis methods utilized in a variety of visual analytics systems. The application and design of visualization and analytical algorithms are subject to design decisions, parameter choices, and many conflicting requirements. As such, this chapter attempts to provide an initial set of guidelines for the creation of the visual representation, including pitfalls and areas where the graphics can be enhanced through interactive exploration. Basic analytical methods are explored as a means of enhancing the visual analysis process, moving from visual analysis to visual analytics. Table of Contents: Data Types / Color Schemes / Data Preconditioning / Visual Representations and Analysis / Summary

Related Products