logo

EbookBell.com

Most ebook files are in PDF format, so you can easily read them using various software such as Foxit Reader or directly on the Google Chrome browser.
Some ebook files are released by publishers in other formats such as .awz, .mobi, .epub, .fb2, etc. You may need to install specific software to read these formats on mobile/PC, such as Calibre.

Please read the tutorial at this link:  https://ebookbell.com/faq 


We offer FREE conversion to the popular formats you request; however, this may take some time. Therefore, right after payment, please email us, and we will try to provide the service as quickly as possible.


For some exceptional file formats or broken links (if any), please refrain from opening any disputes. Instead, email us first, and we will try to assist within a maximum of 6 hours.

EbookBell Team
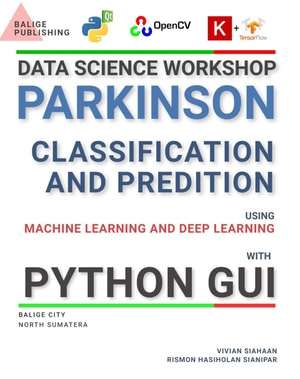
Data Science Workshop Parkinson Classification And Prediction Using Machine Learning And Deep Learning With Python Gui Vivian Siahaan

  • SKU: BELL-51049736
Data Science Workshop Parkinson Classification And Prediction Using Machine Learning And Deep Learning With Python Gui Vivian Siahaan
$ 31.00 $ 45.00 (-31%)

5.0

78 reviews

Data Science Workshop Parkinson Classification And Prediction Using Machine Learning And Deep Learning With Python Gui Vivian Siahaan instant download after payment.

Publisher: BALIGE PUBLISHING
File Extension: EPUB
File size: 19.8 MB
Pages: 546
Author: Vivian Siahaan, Rismon Hasiholan Sianipar
ISBN: B09MF1J9LT
Language: English
Year: 2023

Product desciption

Data Science Workshop Parkinson Classification And Prediction Using Machine Learning And Deep Learning With Python Gui Vivian Siahaan by Vivian Siahaan, Rismon Hasiholan Sianipar B09MF1J9LT instant download after payment.

In this data science workshop focused on Parkinson's disease classification and prediction, we begin by exploring the dataset containing features relevant to the disease. We perform data exploration to understand the structure of the dataset, check for missing values, and gain insights into the distribution of features. Visualizations are used to analyze the distribution of features and their relationship with the target variable, which is whether an individual has Parkinson's disease or not.

Related Products