logo

EbookBell.com

Most ebook files are in PDF format, so you can easily read them using various software such as Foxit Reader or directly on the Google Chrome browser.
Some ebook files are released by publishers in other formats such as .awz, .mobi, .epub, .fb2, etc. You may need to install specific software to read these formats on mobile/PC, such as Calibre.

Please read the tutorial at this link:  https://ebookbell.com/faq 


We offer FREE conversion to the popular formats you request; however, this may take some time. Therefore, right after payment, please email us, and we will try to provide the service as quickly as possible.


For some exceptional file formats or broken links (if any), please refrain from opening any disputes. Instead, email us first, and we will try to assist within a maximum of 6 hours.

EbookBell Team
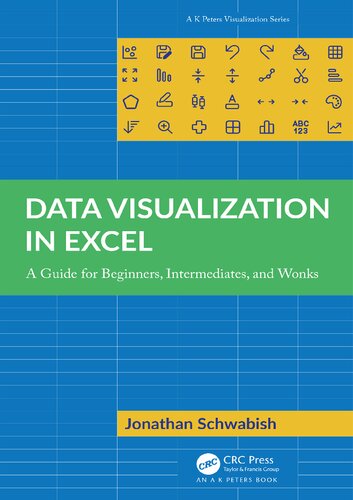
Data Visualization In Excel A Guide For Beginners Intermediates And Wonks Jonathan A Schwabish

  • SKU: BELL-48398316
Data Visualization In Excel A Guide For Beginners Intermediates And Wonks Jonathan A Schwabish
$ 31.00 $ 45.00 (-31%)

5.0

68 reviews

Data Visualization In Excel A Guide For Beginners Intermediates And Wonks Jonathan A Schwabish instant download after payment.

Publisher: CRC Press
File Extension: PDF
File size: 43.46 MB
Pages: 401
Author: Jonathan A. Schwabish
ISBN: 9781003321552, 1003321550
Language: English
Year: 2023

Product desciption

Data Visualization In Excel A Guide For Beginners Intermediates And Wonks Jonathan A Schwabish by Jonathan A. Schwabish 9781003321552, 1003321550 instant download after payment.

The Excel sheets of this book can be downloaded from the Support Material option using:
https://www.routledge.com/Data-Visualization-in-Excel-A-Guide-for-Beginners-Intermediates-and-Wonks/Schwabish/p/book/9781032343266
Data Visualization in Excel closes the gap between what people think Excel can do and what they can achieve in the tool. Over the past few years, recognition of the importance of effectively visualizing data has led to an explosion of data analysis and visualization software tools. But for many people, Microsoft Excel continues to be the workhorse for their data visualization needs, not to mention the only tool that many data workers have access to. Although Excel is not a specialist data visualization platform, it does have strong capabilities. The default chart types do not need to be the limit of the tool's data visualization capabilities, and users can extend its features by understanding some key elements and strategies. This book provides a step-by-step guide to creating more advanced and often more effective data visualizations in Excel and is the perfect guide for anyone who wants to create better, more effective, and more engaging data visualizations. Jonathan Schwabish is an economist and data communication expert working and living outside Washington, DC. Dr. Schwabish is considered a leader in the data visualization field and is a leading voice for clarity and accessibility in research. Dr. Schwabish is a senior fellow at the Urban Institute, a non-profit research institution in Washington, DC, and is the founder of the data visualization and presentation skills firm, Policy Viz. He helps non-profits, research institutions, and governments at all levels improve how they communicate their work and findings to their colleagues, partners, clients, and constituents

Related Products