Product desciption
Displaying Time Series Spatial And Spacetime Data With R Oscar Perpinan Lamigueiro by Oscar Perpinan Lamigueiro 9781138089983, 1138089982 instant download after payment.
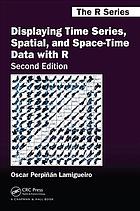
Focusing on the exploration of data with visual methods, Displaying Time Series, Spatial, and Space-Time Data with R, Second Edition, presents methods and R code for producing high-quality static graphics, interactive visualizations, and animations of time series, spatial, and space-time data. Practical examples using real-world datasets help you understand how to apply the methods and code. The book illustrates how to display a dataset starting with an easy and direct approach, and progressively adds improvements that involve more complexity. Each of the three parts of the book is devoted to different types of data. In each part, the chapters are grouped according to the various visualization methods or data characteristics. The first edition of this book was mainly focused on static graphics. Four years later, recent developments in the "htmlwidgets" family of packages are covered in this second edition with many new interactive graphics. In addition, the "ggplot2" approach is now used in most of the spatial graphics, thanks to the new "sf" package. Finally, code has been cleaned and improved, and data has been updated. Features ¿ Offers detailed information on producing high-quality graphics, interactive visualizations, and animations ¿ Uses real data from meteorological, climate, economic, social science, energy, engineering, environmental, and epidemiological research in many practical examples ¿ Shows how to improve graphics based on visualization theory ¿ Provides the graphics, data, and R code on the author¿s website, enabling you to practice with the methods and modify the code to suit your own needs.


