logo

EbookBell.com

Most ebook files are in PDF format, so you can easily read them using various software such as Foxit Reader or directly on the Google Chrome browser.
Some ebook files are released by publishers in other formats such as .awz, .mobi, .epub, .fb2, etc. You may need to install specific software to read these formats on mobile/PC, such as Calibre.

Please read the tutorial at this link:  https://ebookbell.com/faq 


We offer FREE conversion to the popular formats you request; however, this may take some time. Therefore, right after payment, please email us, and we will try to provide the service as quickly as possible.


For some exceptional file formats or broken links (if any), please refrain from opening any disputes. Instead, email us first, and we will try to assist within a maximum of 6 hours.

EbookBell Team
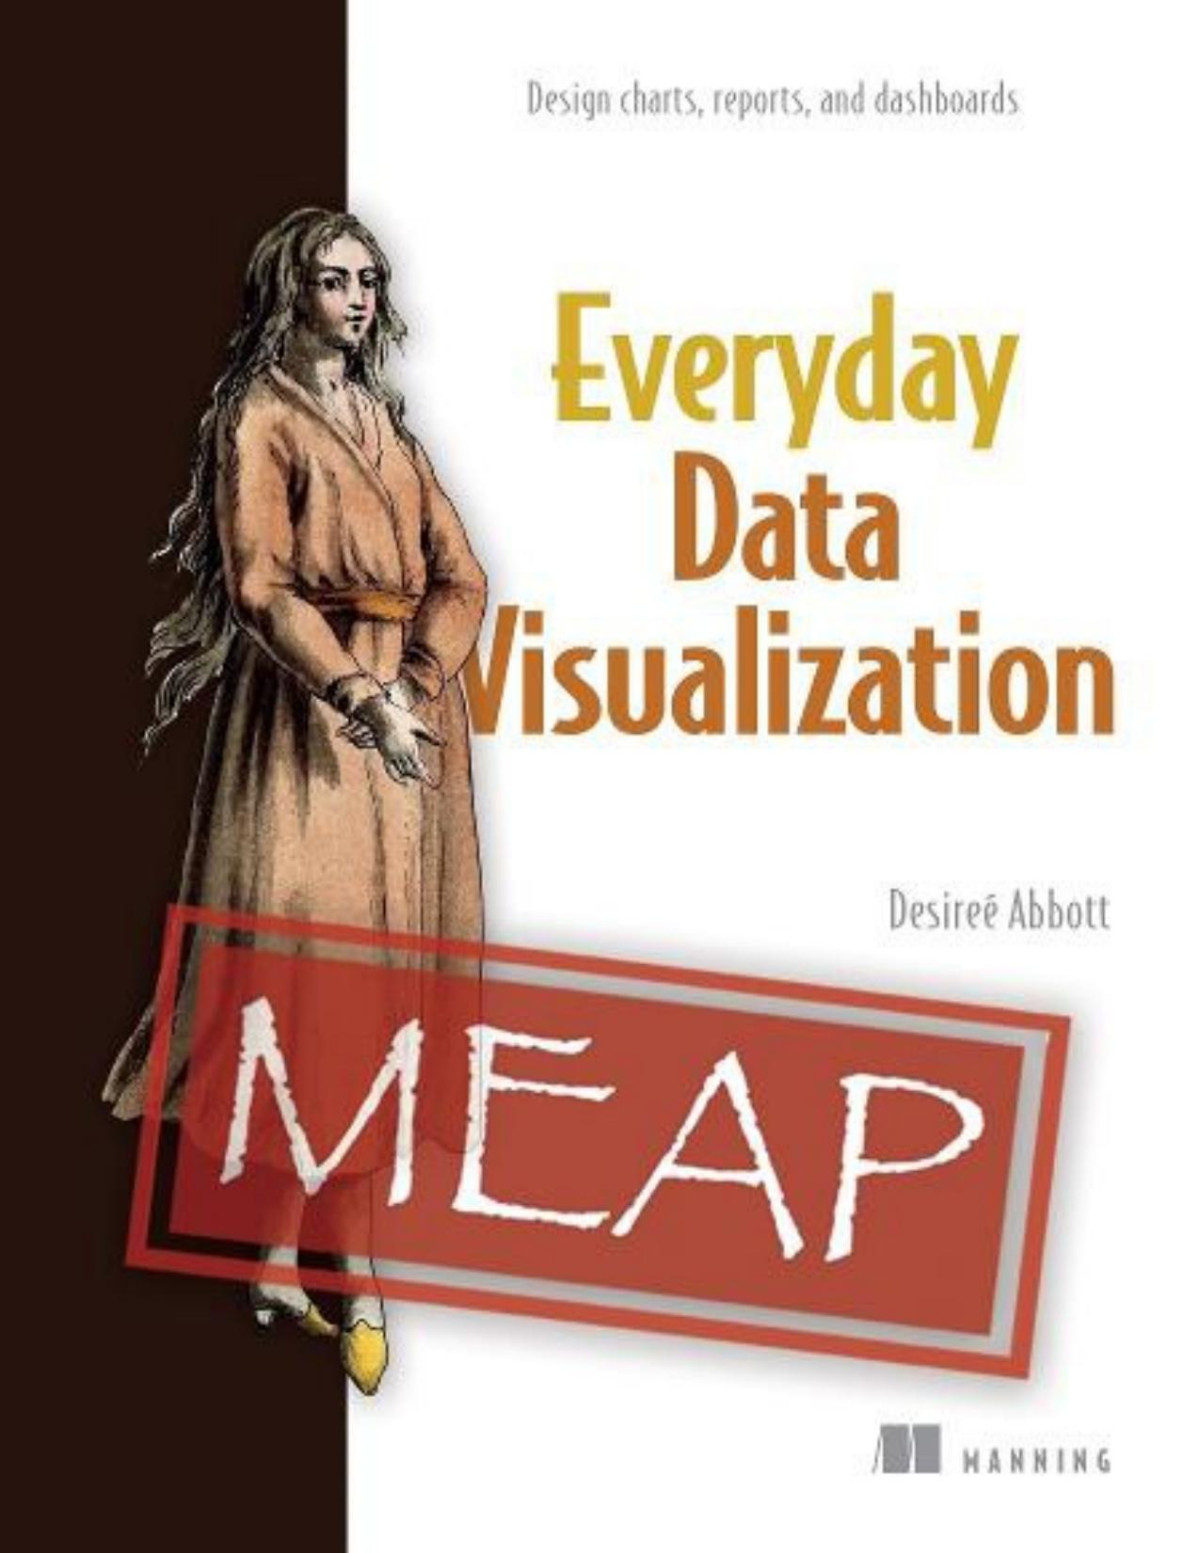
Everyday Data Visualization Meap V05 Chapters 1 To 7 Of 9 Desiree Abbott

  • SKU: BELL-50783264
Everyday Data Visualization Meap V05 Chapters 1 To 7 Of 9 Desiree Abbott
$ 31.00 $ 45.00 (-31%)

4.0

36 reviews

Everyday Data Visualization Meap V05 Chapters 1 To 7 Of 9 Desiree Abbott instant download after payment.

Publisher: Manning Publications
File Extension: PDF
File size: 12 MB
Pages: 295
Author: Desiree Abbott
ISBN: 9781633438408, 1633438406
Language: English
Year: 2023
Edition: Chapters 1 to 7 of 9

Product desciption

Everyday Data Visualization Meap V05 Chapters 1 To 7 Of 9 Desiree Abbott by Desiree Abbott 9781633438408, 1633438406 instant download after payment.

Everyday Data Visualization gives you skills you’ll use to enhance the most common data visualizations, including charts and tables, data dashboards, and infographics. You’ll learn how to use color, typography, positioning, and choice of charts to catch and keep a viewer’s attention. Discover the finesse and design rigor that goes into building delightful dashboards, and best practices for live visualizations that flex and grow as underlying data changes. Design fundamentals are broken down into their component parts so they’re easy to understand—even if you’re the analytical type! Best of all, everything you learn is tool-agnostic, with universal principles you can apply to any data stack.
 
Radically improve the quality of the data visualizations you do every day by mastering core principles of color, typography, chart types, data storytelling, and more!
 
In Everyday Data Visualization you’ll learn important design principles for the most common data visualizations:
• Harness the power of perception to guide a user’s attention
• Effectively use color and other design fundamentals to bring data to life
• Choose the best chart type for the data and the story you want to tell
• Design for interactive visualizations
• Keep the user’s needs first throughout your projects

Related Products