logo

EbookBell.com

Most ebook files are in PDF format, so you can easily read them using various software such as Foxit Reader or directly on the Google Chrome browser.
Some ebook files are released by publishers in other formats such as .awz, .mobi, .epub, .fb2, etc. You may need to install specific software to read these formats on mobile/PC, such as Calibre.

Please read the tutorial at this link:  https://ebookbell.com/faq 


We offer FREE conversion to the popular formats you request; however, this may take some time. Therefore, right after payment, please email us, and we will try to provide the service as quickly as possible.


For some exceptional file formats or broken links (if any), please refrain from opening any disputes. Instead, email us first, and we will try to assist within a maximum of 6 hours.

EbookBell Team
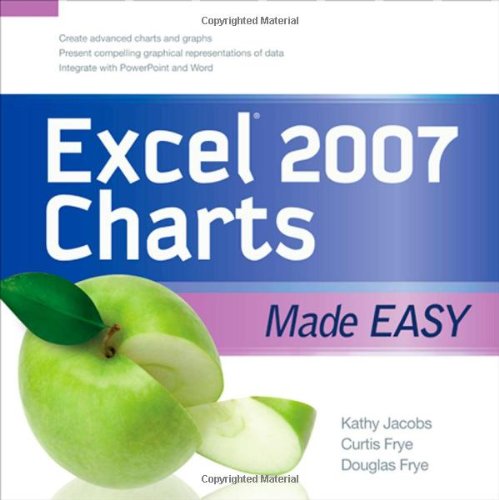
Excel 2007 Charts Made Easy Made Easy Series 1st Edition Kathy Jacobs

  • SKU: BELL-2540680
Excel 2007 Charts Made Easy Made Easy Series 1st Edition Kathy Jacobs
$ 31.00 $ 45.00 (-31%)

0.0

0 reviews

Excel 2007 Charts Made Easy Made Easy Series 1st Edition Kathy Jacobs instant download after payment.

Publisher: McGraw-Hill Osborne Media
File Extension: PDF
File size: 4.17 MB
Pages: 207
Author: Kathy Jacobs, Curt Frye, Doug Frye
ISBN: 007160006X, 9780071600071
Language: English
Year: 2008
Edition: 1

Product desciption

Excel 2007 Charts Made Easy Made Easy Series 1st Edition Kathy Jacobs by Kathy Jacobs, Curt Frye, Doug Frye 007160006X, 9780071600071 instant download after payment.

Get beyond the basics with Excel 2007 chartsNow you can take your Excel charting skills to the next level with help from this hands-on guide. Excel 2007 Charts Made Easy shows you how to upgrade from simple pie and bar charts to rich data visualization using the full range of charts available in the latest version of the software. Discover how easy it is to create custom charts with compelling effects and to display data in more meaningful ways. Manually format chart componentsShow trends in your data with line chartsCombine line and pie charts to create area chartsPlot data using scatter charts and bubble chartsCreate and format stock chartsConnect three data points with a surface chartDisplay the relationship between various data series using doughnut chartsCompare data values with radar chartsUse PivotTables and PivotCharts to work with dynamic dataIncorporate Excel charts into Word documents and PowerPoint presentations 

Related Products