Most ebook files are in PDF format, so you can easily read them using various software such as Foxit Reader or directly on the Google Chrome browser.
Some ebook files are released by publishers in other formats such as .awz, .mobi, .epub, .fb2, etc. You may need to install specific software to read these formats on mobile/PC, such as Calibre.
Please read the tutorial at this link: https://ebookbell.com/faq
We offer FREE conversion to the popular formats you request; however, this may take some time. Therefore, right after payment, please email us, and we will try to provide the service as quickly as possible.
For some exceptional file formats or broken links (if any), please refrain from opening any disputes. Instead, email us first, and we will try to assist within a maximum of 6 hours.
EbookBell Team
4.1
70 reviews
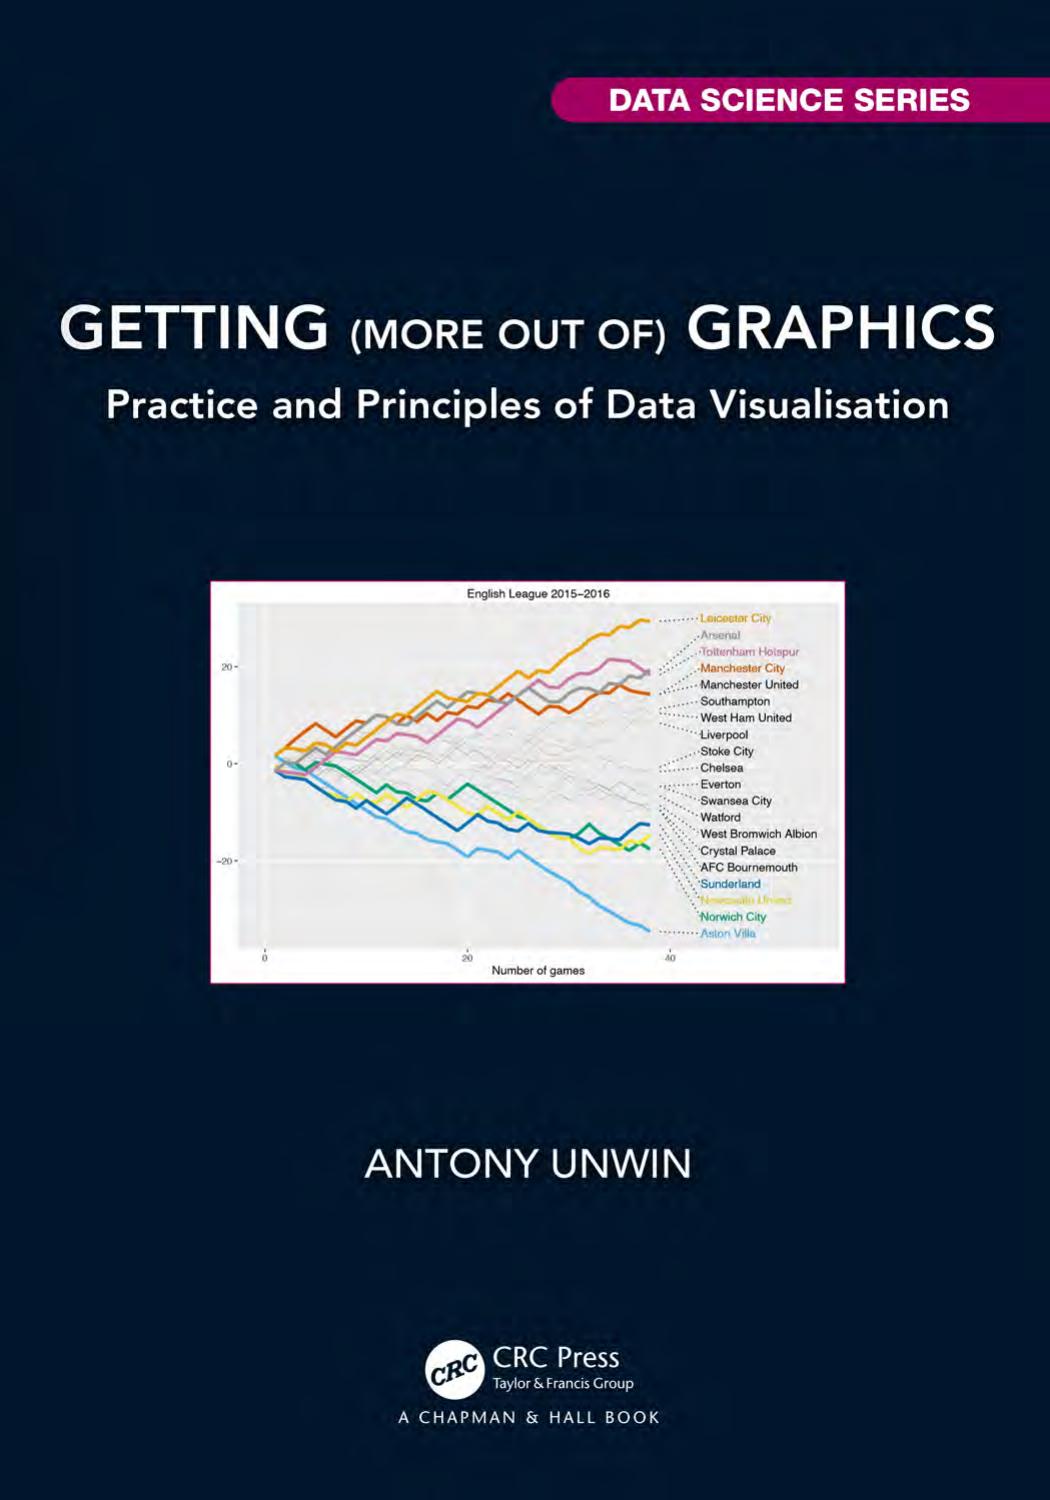
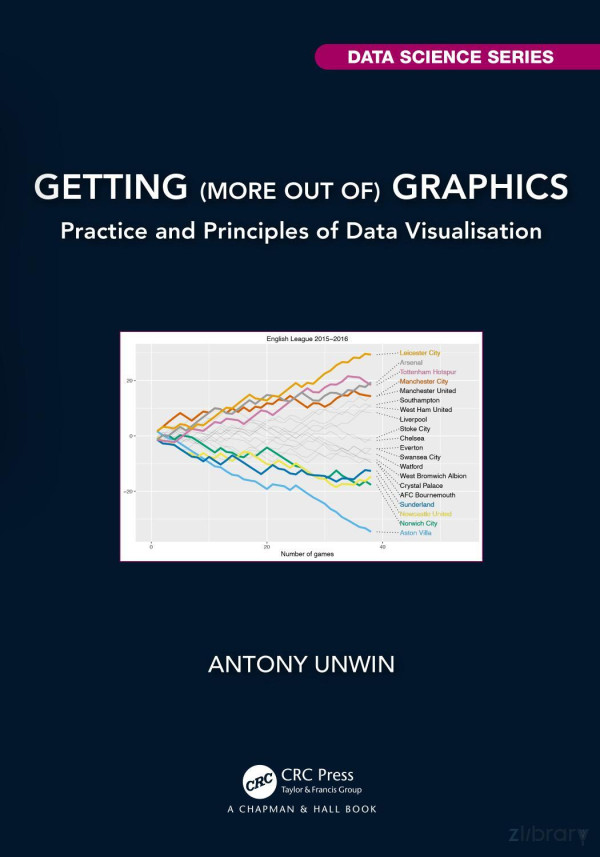
ISBN 13: 9781040035474
Author: Antony Unwin
Data graphics are used extensively to present information. Understanding graphics is a lot about understanding the data represented by the graphics, having a feel not just for the numbers themselves, the reliability and uncertainty associated with them, but also for what they mean. This book presents a practical approach to data visualisation with real applications front and centre. The first part of the book is a series of case studies, each describing a graphical analysis of a real dataset. The second part pulls together ideas from the case studies and provides an overview of the main factors affecting understanding graphics. Key Features: Explains how to get insights from graphics. Emphasises the value of drawing many graphics. Underlines the importance for analysis of background knowledge and context. Readers may be data scientists, statisticians or people who want to become more visually literate. A knowledge of Statistics is not required, just an interest in data graphics and some experience of working with data. It will help if the reader knows something of basic graphic forms such as barcharts, histograms, and scatterplots.
1 Introduction
1.1 What are good graphics?
1.2 Graphics examples
1.3 Writing about graphics
1.4 Reading about graphics
1.5 Software
1.6 Structure of the book
In a nutshell (tl;dr)
I Graphics in Action
2 Graphics and Gapminder
2.1 Gapminder and Hans Rosling
2.2 What else can be seen in Gapminder's plots?
2.3 Analysis by regions of the world
2.4 Checking what is in the data
2.5 The importance of data definitions
2.6 Discussion
3 Looking at the movies
3.1 Trailer
3.2 Movies in IMDb over the years
3.3 What might IMDb code numbers mean?
3.4 What ratings do people give films?
3.5 Genres from Rom-Com to Film Noir
3.6 Comparing Raging Bull with Jane Austen
4 Voting 46 times to choose a Presidential candidate
4.1 A first look at the 1912 Democratic Convention
4.2 The USA in 1912 and 2020
4.3 How the nomination contest unfolded
4.4 When did the ballots actually take place?
5 Measuring the speed of light
5.1 Michelson, the Master of Light, and his data
5.2 Newcomb, self-educated polymath, and his data
5.3 Comparing the data of Michelson and Newcomb
6 The modern Olympic Games in numbers
6.1 How good are the data?
6.2 How much have performances improved?
6.3 How many countries and individuals competed?
7 Re-viewing Bertin's main example
7.1 Bertin's classic book
7.2 Bertin's many graphics of the French workforce data
7.3 Viewing the data today
7.4 Are there other geographic patterns?
7.5 Density of the workforce by area
7.6 Comments on Bertin (with hindsight)
8 Comparing chess players across the board
8.1 FIDE ratings of chess players
8.2 Comparing chess players by age and sex
8.3 Which nations have the best chess players?
8.4 Ratings change over time
8.5 Grandmasters and Masters
9 Results from surveys on gay rights
9.1 Survey results by age, sex, and race
9.2 Mapping the survey results
9.3 Comparing responses to related, but different questions
10 Who went up in space for how long?
10.1 What human spaceflights have there been?
10.2 Mission times in space
10.3 Checking the data with graphics
11 Data in the sky at night
11.1 Data on diamonds for sale
11.2 Checking for outliers and unusual values
11.3 Intriguing features
12 Psoriasis and the Quality of Life
12.1 Comparing treatment and placebo groups
12.2 Examining responses to individual questions
13 Charging electric cars
13.1 How was the study organised?
13.2 How long does charging cars take?
13.3 Charging patterns through the week
14 Darwin's Finches
14.1 How do Darwin's finches differ?
14.2 Do species vary across the Galápagos islands?
15 Home or away: where do soccer players play?
15.1 The European Football Championship since 1960
15.2 Which leagues do international players play in?
15.3 How have countries changed?
16 Watching soccer—the English leagues
16.1 History of the English football leagues since 1888
16.2 How have numbers of draws changed?
16.3 How big is home advantage?
16.4 Have the numbers of goals scored gone down?
16.5 How well have teams performed over the years?
16.6 Wormcharts show league progress over a season
17 Fuel efficiency of cars in the USA
17.1 How efficient are different types of car?
17.2 Small (?) luxury cars
17.3 How many car models have been evaluated over the years?
17.4 Comparing fuel efficiency of individual models over time
18 Differences amongst the Palmer penguins
18.1 Getting an overview of the penguin data
18.2 Looking at several variables in one plot
18.3 Using raw data to get more information
19 Comparing tests for malaria
19.1 How much agreement is there between the four tests?
19.2 Additional analyses
20 Are swimmers swimming faster?
20.1 Best times for different strokes
20.2 How good are the best swimmers across multiple events?
20.3 Comparing events graphically
20.4 How do relay races compare with individual races?
20.5 How do countries compare?
21 Over 90 years running 90 km
21.1 How many run in the Comrades (Ultra)Marathon?
21.2 Numbers by age and sex
21.3 How long do runners take to finish?
21.4 Comparing times for men and women
21.5 How many runners get medals?
21.6 How different are the “up” and “down” races?
21.7 How do individual runners perform over the years?
22 Comparing software for facial recognition
22.1 How well do the softwares do?
22.2 Are positive predictive values (PPV) a good criterion?
23 Distinguishing shearwaters
23.1 Distinguishing shearwaters and puffins
23.2 Comparing two shearwater species (Audubon and Galápagos)
23.3 Can the species be clustered?
24 When do road accidents with deer happen in Bavaria?
24.1 Vehicle accidents involving deer
24.2 What about vehicle accidents without deer?
25 The Titanic Disaster
25.1 Who travelled on the Titanic?
25.2 Which groups had high survival rates?
26 German Election 2021—what happened?
26.1 Who won the 2021 election?
26.2 Are there geographic patterns?
26.3 Who won the first-past-the-post seats?
26.4 How do first-past-the-post and party votes compare?
II Advice on Graphics
27 Provenance and quality
27.1 What does provenance mean?
27.2 What problems arise with datasets?
27.3 The provenance of datasets used in the book
27.4 How do invented, simulated, and real datasets compare?
28 Wrangling
28.1 Data wrangling: what and why
28.2 Data cleaning and transforming
28.3 Restructuring: subsetting, grouping, aggregating
28.4 Naming, renaming and reclassifying
28.5 Wrangling for layered graphics
28.6 Putting datasets together and reproducibility
29 Colour
29.1 Theory and implementation
29.2 Perception of colour
29.3 Value of colour
29.4 Choice of colour
30 Setting the scene
30.1 Scaling
30.2 Formatting
30.3 Making space
30.4 Layout
30.5 Comparisons and graphics
30.6 Defaults
31 Ordering, sorting, and arranging
31.1 What gets ordered, sorted, arranged?
31.2 Ordering and sorting within graphics
31.3 Numbers of orderings and sortings
31.4 Arranging graphics
32 What affects interpretation?
32.1 Attention
32.2 Understanding
32.3 Checking
33 Varieties of plots, developing plots
33.1 Varying various plots
33.2 Ensembles of plots
33.3 Differences between early drafts and later graphics
33.4 Classifying graphics
34 Conclusions and recommendations
References
getting more out of graphics unwin
how to get more fps out of your graphics card
why are my graphics so bad on xbox
get better graphics on xbox one
get more vram
video game graphics getting worse
which has better graphics
Tags: Antony Unwin, Graphics, Getting