logo

EbookBell.com

Most ebook files are in PDF format, so you can easily read them using various software such as Foxit Reader or directly on the Google Chrome browser.
Some ebook files are released by publishers in other formats such as .awz, .mobi, .epub, .fb2, etc. You may need to install specific software to read these formats on mobile/PC, such as Calibre.

Please read the tutorial at this link:  https://ebookbell.com/faq 


We offer FREE conversion to the popular formats you request; however, this may take some time. Therefore, right after payment, please email us, and we will try to provide the service as quickly as possible.


For some exceptional file formats or broken links (if any), please refrain from opening any disputes. Instead, email us first, and we will try to assist within a maximum of 6 hours.

EbookBell Team
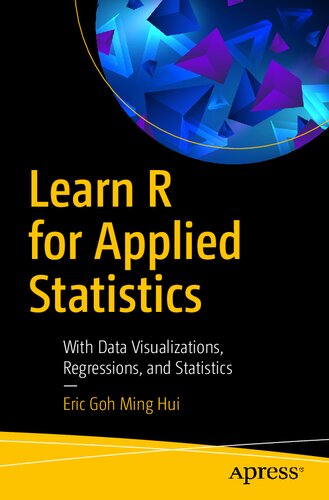
Learn R For Applied Statistics With Data Visualizations Regressions And Statistics 1st Edition Eric Goh Ming Hui

  • SKU: BELL-23660638
Learn R For Applied Statistics With Data Visualizations Regressions And Statistics 1st Edition Eric Goh Ming Hui
$ 31.00 $ 45.00 (-31%)

5.0

30 reviews

Learn R For Applied Statistics With Data Visualizations Regressions And Statistics 1st Edition Eric Goh Ming Hui instant download after payment.

Publisher: Apress
File Extension: PDF
File size: 6.78 MB
Pages: 260
Author: Eric Goh Ming Hui
ISBN: 9781484241998, 1484241991
Language: English
Year: 2018
Edition: 1

Product desciption

Learn R For Applied Statistics With Data Visualizations Regressions And Statistics 1st Edition Eric Goh Ming Hui by Eric Goh Ming Hui 9781484241998, 1484241991 instant download after payment.

Gain the R programming language fundamentals for doing the applied statistics useful for data exploration and analysis in data science and data mining. This book covers topics ranging from R syntax basics, descriptive statistics, and data visualizations to inferential statistics and regressions. After learning R’s syntax, you will work through data visualizations such as histograms and boxplot charting, descriptive statistics, and inferential statistics such as t-test, chi-square test, ANOVA, non-parametric test, and linear regressions. 
Learn R for Applied Statistics is a timely skills-migration book that equips you with the R programming fundamentals and introduces you to applied statistics for data explorations. 
What You Will Learn
  • Discover R, statistics, data science, data mining, and big data
  • Master the fundamentals of R programming, including variables and arithmetic, vectors, lists, data frames, conditional statements, loops, and functions
  • Work with descriptive statistics 
  • Create data visualizations, including bar charts, line charts, scatter plots, boxplots, histograms, and scatterplots
  • Use inferential statistics including t-tests, chi-square tests, ANOVA, non-parametric tests, linear regressions, and multiple linear regressions

Who This Book Is For
Those who are interested in data science, in particular data exploration using applied statistics, and the use of R programming for data visualizations.  

Related Products