Most ebook files are in PDF format, so you can easily read them using various software such as Foxit Reader or directly on the Google Chrome browser.
Some ebook files are released by publishers in other formats such as .awz, .mobi, .epub, .fb2, etc. You may need to install specific software to read these formats on mobile/PC, such as Calibre.
Please read the tutorial at this link: https://ebookbell.com/faq
We offer FREE conversion to the popular formats you request; however, this may take some time. Therefore, right after payment, please email us, and we will try to provide the service as quickly as possible.
For some exceptional file formats or broken links (if any), please refrain from opening any disputes. Instead, email us first, and we will try to assist within a maximum of 6 hours.
EbookBell Team
4.1
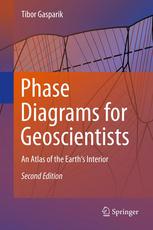
100 reviewsThe book summarizes the author's experimental studies of phase relations in the chemical systems relevant to Earth, carried out in a time period of over 20 years using piston-cylinder and multi-avil presses. A summary of the research at high pressures and temperatures carried out by many other experimental petrologists is also included. The data was used to develop an internally consistent thermodynamic model, which was then used to calculate phase diagrams. This produced the largest collection of the calculated phase diagrams published so far, encompassing for the first time the temperature and pressure ranges corresponding to the whole upper mantle.