
Most ebook files are in PDF format, so you can easily read them using various software such as Foxit Reader or directly on the Google Chrome browser.
Some ebook files are released by publishers in other formats such as .awz, .mobi, .epub, .fb2, etc. You may need to install specific software to read these formats on mobile/PC, such as Calibre.
Please read the tutorial at this link: https://ebookbell.com/faq
We offer FREE conversion to the popular formats you request; however, this may take some time. Therefore, right after payment, please email us, and we will try to provide the service as quickly as possible.
For some exceptional file formats or broken links (if any), please refrain from opening any disputes. Instead, email us first, and we will try to assist within a maximum of 6 hours.
EbookBell Team

4.0
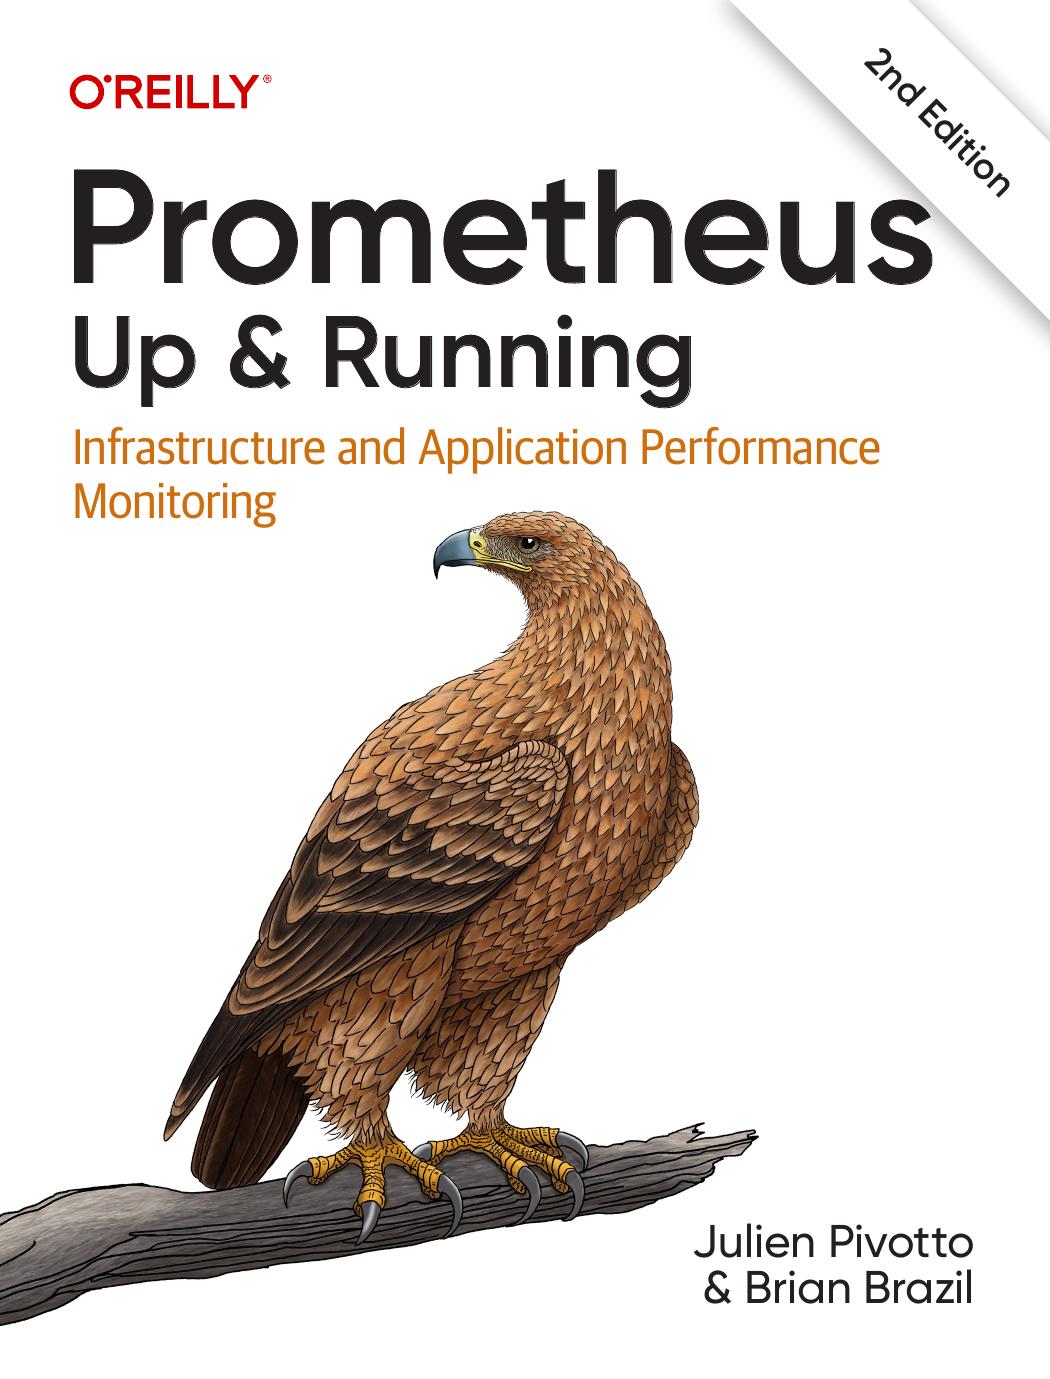
76 reviewsPrometheus server maintainer Julien Pivotto and core developer Brian Brazil demonstrate how you can use Prometheus for application and infrastructure monitoring. This book guides you through Prometheus setup, the Node Exporter, and the Alertmanager, and then shows you how to use these tools for application and infrastructure monitoring. You'll understand why this open source system has continued to gain popularity in recent years.
You will:
• Know where and how much instrumentation to apply to your application code
• Monitor your infrastructure with Node Exporter and use new collectors for network system pressure metrics
• Get an introduction to Grafana, a popular tool for building dashboards
• Use service discovery and the new HTTP SD monitoring system to provide different views of your machines and services
• Use Prometheus with Kubernetes and examine exporters you can use with containers
• Discover Prom's new improvements and features, including trigonometry functions
• Learn how Prometheus supports important security features including TLS and basic authentication