logo

EbookBell.com

Most ebook files are in PDF format, so you can easily read them using various software such as Foxit Reader or directly on the Google Chrome browser.
Some ebook files are released by publishers in other formats such as .awz, .mobi, .epub, .fb2, etc. You may need to install specific software to read these formats on mobile/PC, such as Calibre.

Please read the tutorial at this link:  https://ebookbell.com/faq 


We offer FREE conversion to the popular formats you request; however, this may take some time. Therefore, right after payment, please email us, and we will try to provide the service as quickly as possible.


For some exceptional file formats or broken links (if any), please refrain from opening any disputes. Instead, email us first, and we will try to assist within a maximum of 6 hours.

EbookBell Team
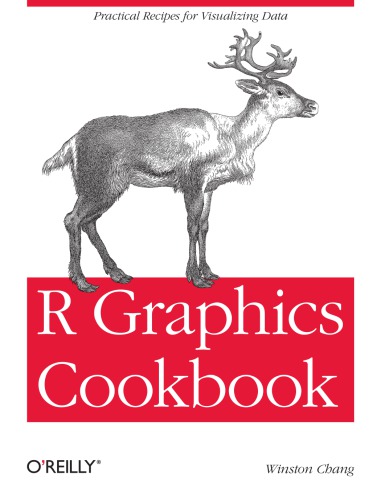
R Graphics Cookbook Chang Winston

  • SKU: BELL-22122898
R Graphics Cookbook Chang Winston
$ 31.00 $ 45.00 (-31%)

5.0

60 reviews

R Graphics Cookbook Chang Winston instant download after payment.

Publisher: O'Reilly Media
File Extension: PDF
File size: 27.38 MB
Pages: 416
Author: Chang, Winston
ISBN: 9781449316952, 9783093133176, 1449316956, 3093133173
Language: English
Year: 2013

Product desciption

R Graphics Cookbook Chang Winston by Chang, Winston 9781449316952, 9783093133176, 1449316956, 3093133173 instant download after payment.

This practical guide provides more than 150 recipes to help you generate high-quality graphs quickly, without having to comb through all the details of R’s graphing systems. Each recipe tackles a specific problem with a solution you can apply to your own project, and includes a discussion of how and why the recipe works.
Most of the recipes use the ggplot2 package, a powerful and flexible way to make graphs in R. If you have a basic understanding of the R language, you’re ready to get started.
Use R’s default graphics for quick exploration of data
Create a variety of bar graphs, line graphs, and scatter plots
Summarize data distributions with histograms, density curves, box plots, and other examples
Provide annotations to help viewers interpret data
Control the overall appearance of graphics
Render data groups alongside each other for easy comparison
Use colors in plots
Create network graphs, heat maps, and 3D scatter plots
Structure data for graphing

Related Products