logo

EbookBell.com

Most ebook files are in PDF format, so you can easily read them using various software such as Foxit Reader or directly on the Google Chrome browser.
Some ebook files are released by publishers in other formats such as .awz, .mobi, .epub, .fb2, etc. You may need to install specific software to read these formats on mobile/PC, such as Calibre.

Please read the tutorial at this link:  https://ebookbell.com/faq 


We offer FREE conversion to the popular formats you request; however, this may take some time. Therefore, right after payment, please email us, and we will try to provide the service as quickly as possible.


For some exceptional file formats or broken links (if any), please refrain from opening any disputes. Instead, email us first, and we will try to assist within a maximum of 6 hours.

EbookBell Team
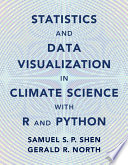
Statistics And Data Visualization In Climate Science With R And Python Samual S P Shen

  • SKU: BELL-53751022
Statistics And Data Visualization In Climate Science With R And Python Samual S P Shen
$ 31.00 $ 45.00 (-31%)

0.0

0 reviews

Statistics And Data Visualization In Climate Science With R And Python Samual S P Shen instant download after payment.

Publisher: Cambridge University Press
File Extension: PDF
File size: 35.54 MB
Pages: 415
Author: Samual S. P. Shen, Gerald R. North
ISBN: 9781108842570, 1108842577
Language: English
Year: 2023

Product desciption

Statistics And Data Visualization In Climate Science With R And Python Samual S P Shen by Samual S. P. Shen, Gerald R. North 9781108842570, 1108842577 instant download after payment.

A comprehensive overview of essential statistical concepts, useful statistical methods, data visualization, and modern computing tools for the climate sciences and many others such as geography and environmental engineering. It is an invaluable reference for students and researchers in climatology and its connected fields who wish to learn data science, statistics, R and Python programming. The examples and exercises in the book empower readers to work on real climate data from station observations, remote sensing and simulated results. For example, students can use R or Python code to read and plot the global warming data and the global precipitation data in netCDF, csv, txt, or JSON; and compute and interpret empirical orthogonal functions. The book's computer code and real-world data allow readers to fully utilize the modern computing technology and updated datasets. Online supplementary resources include R code and Python code, data files, figure files, tutorials, slides and sample syllabi.

Related Products