logo

EbookBell.com

Most ebook files are in PDF format, so you can easily read them using various software such as Foxit Reader or directly on the Google Chrome browser.
Some ebook files are released by publishers in other formats such as .awz, .mobi, .epub, .fb2, etc. You may need to install specific software to read these formats on mobile/PC, such as Calibre.

Please read the tutorial at this link:  https://ebookbell.com/faq 


We offer FREE conversion to the popular formats you request; however, this may take some time. Therefore, right after payment, please email us, and we will try to provide the service as quickly as possible.


For some exceptional file formats or broken links (if any), please refrain from opening any disputes. Instead, email us first, and we will try to assist within a maximum of 6 hours.

EbookBell Team
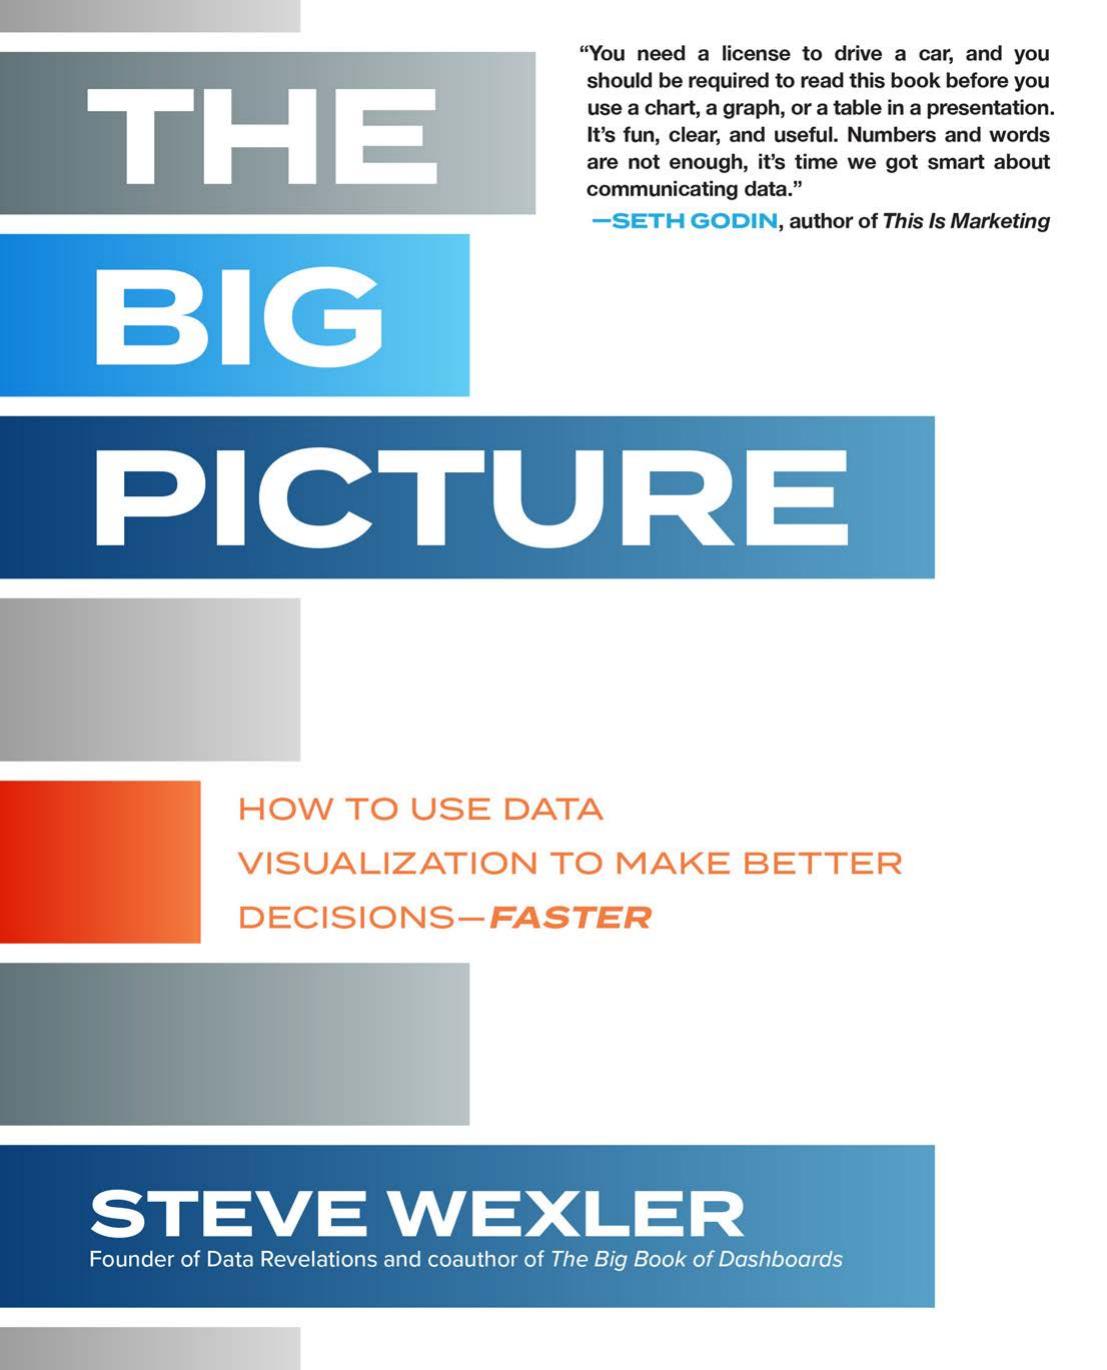
The Big Picture How To Use Data Visualization To Make Better Decisionsfaster Steve Wexler

  • SKU: BELL-51753956
The Big Picture How To Use Data Visualization To Make Better Decisionsfaster Steve Wexler
$ 31.00 $ 45.00 (-31%)

5.0

88 reviews

The Big Picture How To Use Data Visualization To Make Better Decisionsfaster Steve Wexler instant download after payment.

Publisher: McGraw Hill Professional
File Extension: PDF
File size: 13.7 MB
Author: Steve Wexler
ISBN: 9781260473537, 1260473538
Language: English
Year: 2021

Product desciption

The Big Picture How To Use Data Visualization To Make Better Decisionsfaster Steve Wexler by Steve Wexler 9781260473537, 1260473538 instant download after payment.

Not a data expert? Here’s an engaging and entertaining guide to interpreting and drawing insights from any chart, graph, or other data visualization you’ll encounter. You’re a business professional, not a data scientist. How do you make heads or tails of the data visualizations that come across your desk—let alone make critical business decisions based on the information they’re designed to convey? In The Big Picture, top data visualization consultant Steve Wexler provides the tools for developing the graphical literacy you need to understand the data visualizations that are flooding your inbox—and put that data to use. Packed with the best four-color examples created in Excel, Tableau, Power BI, and Qlik, among others, this one-stop resource empowers you to extract the most important information from data visualizations quickly and accurately, act on key insights, solve problems, and make the right decisions for your organization every time.

Related Products