logo

EbookBell.com

Most ebook files are in PDF format, so you can easily read them using various software such as Foxit Reader or directly on the Google Chrome browser.
Some ebook files are released by publishers in other formats such as .awz, .mobi, .epub, .fb2, etc. You may need to install specific software to read these formats on mobile/PC, such as Calibre.

Please read the tutorial at this link:  https://ebookbell.com/faq 


We offer FREE conversion to the popular formats you request; however, this may take some time. Therefore, right after payment, please email us, and we will try to provide the service as quickly as possible.


For some exceptional file formats or broken links (if any), please refrain from opening any disputes. Instead, email us first, and we will try to assist within a maximum of 6 hours.

EbookBell Team
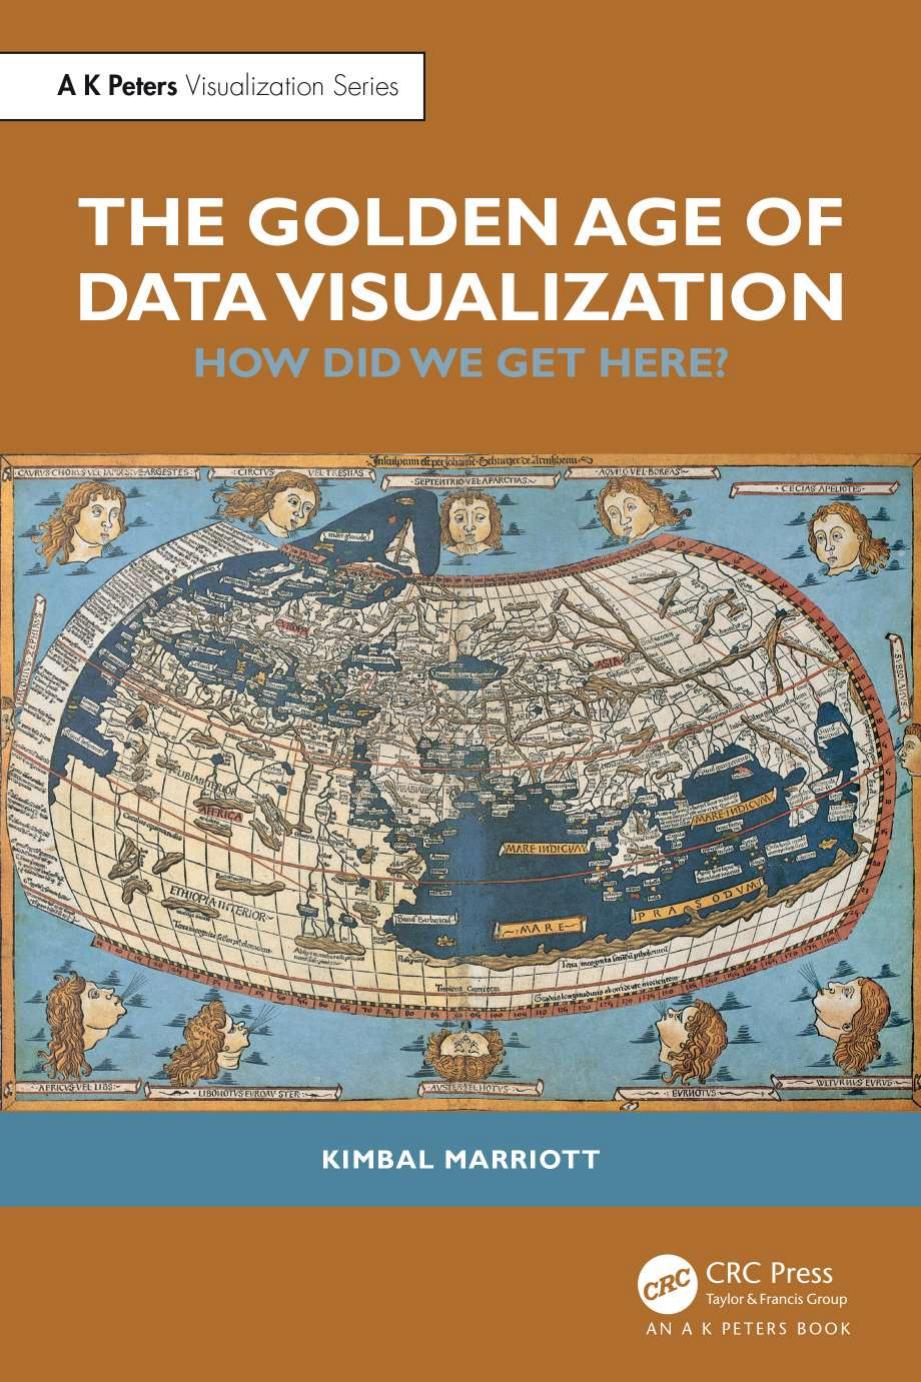
The Golden Age Of Data Visualization How Did We Get Here Kimbal Marriott

  • SKU: BELL-59779196
The Golden Age Of Data Visualization How Did We Get Here Kimbal Marriott
$ 31.00 $ 45.00 (-31%)

5.0

108 reviews

The Golden Age Of Data Visualization How Did We Get Here Kimbal Marriott instant download after payment.

Publisher: CRC Press
File Extension: PDF
File size: 36.09 MB
Author: Kimbal Marriott
Language: English
Year: 2025

Product desciption

The Golden Age Of Data Visualization How Did We Get Here Kimbal Marriott by Kimbal Marriott instant download after payment.

We are living in the Golden Age of Data Visualization. The COVID-19 pandemic has demonstrated how we increasingly use data visualizations to make sense of the world. Business analysts fill their presentations with charts, journalists use infographics to engage their readers, we rely on the dials and gauges on our household appliances, and we use mapping apps on our smartphones to find our way.This book explains how and why this has happened. It details the evolution of information graphics, the kinds of graphics at the core of data visualizationâ••maps, diagrams, charts, scientific and medical imagesâ••from prehistory to the present day. It explains how the cultural context, production and presentation technologies, and data availability have shaped the history of data visualization. It considers the perceptual and cognitive reasons why data visualization is so effective and explores the little-known world of tactile graphicsâ••raised-line drawings used by people who are blind. The book also investigates the way visualization has shaped our modern world. The European Renaissance and the Scientific Revolution relied on maps and technical and scientific drawings, and graphics influence how we think about abstract concepts like time and social connection.This book is written for data visualization researchers and professionals and anyone interested in data visualization and the way we use graphics to understand and think about the world.

Related Products