logo

EbookBell.com

Most ebook files are in PDF format, so you can easily read them using various software such as Foxit Reader or directly on the Google Chrome browser.
Some ebook files are released by publishers in other formats such as .awz, .mobi, .epub, .fb2, etc. You may need to install specific software to read these formats on mobile/PC, such as Calibre.

Please read the tutorial at this link:  https://ebookbell.com/faq 


We offer FREE conversion to the popular formats you request; however, this may take some time. Therefore, right after payment, please email us, and we will try to provide the service as quickly as possible.


For some exceptional file formats or broken links (if any), please refrain from opening any disputes. Instead, email us first, and we will try to assist within a maximum of 6 hours.

EbookBell Team
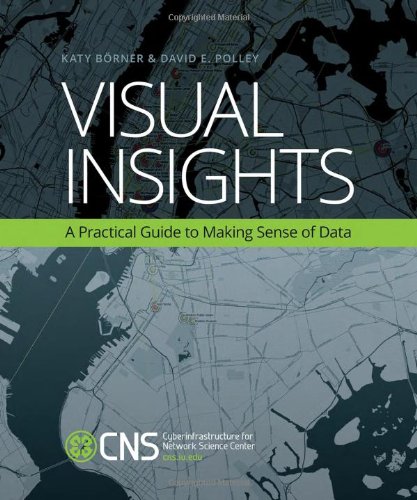
Visual Insights A Practical Guide To Making Sense Of Data Polley

  • SKU: BELL-5288562
Visual Insights A Practical Guide To Making Sense Of Data Polley
$ 31.00 $ 45.00 (-31%)

0.0

0 reviews

Visual Insights A Practical Guide To Making Sense Of Data Polley instant download after payment.

Publisher: The MIT Press
File Extension: PDF
File size: 33.2 MB
Pages: 297
Author: Polley, David E.; Börner, Katy
ISBN: 9780262526197, 9780262320238, 0262526190, 0262320231
Language: English
Year: 2014

Product desciption

Visual Insights A Practical Guide To Making Sense Of Data Polley by Polley, David E.; Börner, Katy 9780262526197, 9780262320238, 0262526190, 0262320231 instant download after payment.

In the age of Big Data, the tools of information visualization offer us a macroscope to help us make sense of the avalanche of data available on every subject. This book offers a gentle introduction to the design of insightful information visualizations. It is the only book on the subject that teaches nonprogrammers how to use open code and open data to design insightful visualizations. Readers will learn to apply advanced data mining and visualization techniques to make sense of temporal, geospatial, topical, and network data.
The book, developed for use in an information visualization MOOC, covers data analysis algorithms that enable extraction of patterns and trends in data, with chapters devoted to «when» (temporal data), «where» (geospatial data), «what» (topical data), and «with whom» (networks and trees) and to systems that drive research and development. Examples of projects undertaken for clients include an interactive visualization of the success of game player activity in World of Warcraft a visualization of 311 number adoption that shows the diffusion of non-emergency calls in the United States a return on investment study for two decades of HIV/AIDS research funding by NIAID and a map showing the impact of the HiveNYC Learning Network. Visual Insights will be an essential resource on basic information visualization techniques for scholars in many fields, students, designers, or anyone who works with data.

Related Products