logo

EbookBell.com

Most ebook files are in PDF format, so you can easily read them using various software such as Foxit Reader or directly on the Google Chrome browser.
Some ebook files are released by publishers in other formats such as .awz, .mobi, .epub, .fb2, etc. You may need to install specific software to read these formats on mobile/PC, such as Calibre.

Please read the tutorial at this link:  https://ebookbell.com/faq 


We offer FREE conversion to the popular formats you request; however, this may take some time. Therefore, right after payment, please email us, and we will try to provide the service as quickly as possible.


For some exceptional file formats or broken links (if any), please refrain from opening any disputes. Instead, email us first, and we will try to assist within a maximum of 6 hours.

EbookBell Team
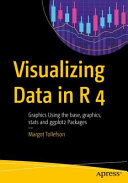
Visualizing Data In R 4 Graphics Using The Base Graphics Stats And Ggplot2 Packages 1st Edition Margot Tollefson

  • SKU: BELL-23948674
Visualizing Data In R 4 Graphics Using The Base Graphics Stats And Ggplot2 Packages 1st Edition Margot Tollefson
$ 31.00 $ 45.00 (-31%)

4.7

46 reviews

Visualizing Data In R 4 Graphics Using The Base Graphics Stats And Ggplot2 Packages 1st Edition Margot Tollefson instant download after payment.

Publisher: Apress
File Extension: PDF
File size: 8.08 MB
Pages: 404
Author: Margot Tollefson
ISBN: 9781484268308, 148426830X
Language: English
Year: 2021
Edition: 1

Product desciption

Visualizing Data In R 4 Graphics Using The Base Graphics Stats And Ggplot2 Packages 1st Edition Margot Tollefson by Margot Tollefson 9781484268308, 148426830X instant download after payment.

Master the syntax for working with R’s plotting functions in graphics and stats in this easy reference to formatting plots. The approach in Visualizing Data in R 4 toward the application of formatting in ggplot() will follow the structure of the formatting used by the plotting functions in graphics and stats. This book will take advantage of the new features added to R 4 where appropriate including a refreshed color palette for charts, Cairo graphics with more fonts/symbols, and improved performance from grid graphics including ggplot 2 rendering speed.
Visualizing Data in R 4 starts with an introduction and then is split into two parts and six appendices. Part I covers the function plot() and the ancillary functions you can use with plot(). You’ll also see the functions par() and layout(), providing for multiple plots on a page. Part II goes over the basics of using the functions qplot() and ggplot() in the package ggplot2. The default plots generated by the functions qplot() and ggplot() give more sophisticated-looking plots than the default plots done by plot() and are easier to use, but the function plot() is more flexible. Both plot() and ggplot() allow for many layers to a plot.
The six appendices will cover plots for contingency tables, plots for continuous variables, plots for data with a limited number of values, functions that generate multiple plots, plots for time series analysis, and some miscellaneous plots. Some of the functions that will be in the appendices include functions that generate histograms, bar charts, pie charts, box plots, and heatmaps.

Related Products

Visualizing Data Ben Fry

4.3

68 reviews
$45.00 $31.00