logo

EbookBell.com

Most ebook files are in PDF format, so you can easily read them using various software such as Foxit Reader or directly on the Google Chrome browser.
Some ebook files are released by publishers in other formats such as .awz, .mobi, .epub, .fb2, etc. You may need to install specific software to read these formats on mobile/PC, such as Calibre.

Please read the tutorial at this link:  https://ebookbell.com/faq 


We offer FREE conversion to the popular formats you request; however, this may take some time. Therefore, right after payment, please email us, and we will try to provide the service as quickly as possible.


For some exceptional file formats or broken links (if any), please refrain from opening any disputes. Instead, email us first, and we will try to assist within a maximum of 6 hours.

EbookBell Team
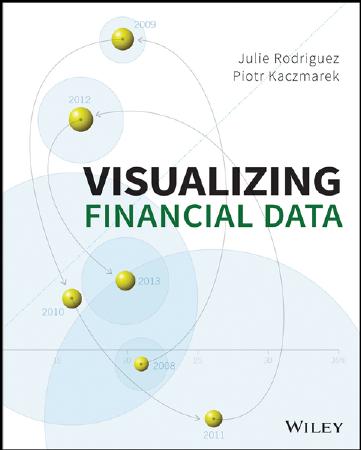
Visualizing Financial Data 1st Edition Julie Rodriguez Piotr Kaczmarek

  • SKU: BELL-57017452
Visualizing Financial Data 1st Edition Julie Rodriguez Piotr Kaczmarek
$ 35.00 $ 45.00 (-22%)

4.8

34 reviews

Visualizing Financial Data 1st Edition Julie Rodriguez Piotr Kaczmarek instant download after payment.

Publisher: John Wiley & Sons
File Extension: PDF
File size: 15.63 MB
Pages: 480
Author: Julie Rodriguez, Piotr Kaczmarek
ISBN: 9781118907986, 1118907981
Language: English
Year: 2016
Edition: 1

Product desciption

Visualizing Financial Data 1st Edition Julie Rodriguez Piotr Kaczmarek by Julie Rodriguez, Piotr Kaczmarek 9781118907986, 1118907981 instant download after payment.

A fresh take on financial data visualization for greater accuracy and understanding Your data provides a snapshot of the state of your business and is key to the success of your conversations, decisions, and communications. But all of that communication is lost — or incorrectly interpreted — without proper data visualizations that provide context and accurate representation of the numbers. In Visualizing Financial Data, authors Julie Rodriguez and Piotr Kaczmarek draw upon their understanding of information design and visual communication to show you how to turn your raw data into meaningful information. Coverage includes current conventions paired with innovative visualizations that cater to the unique requirements across financial domains, including investment management, financial accounting, regulatory reporting, sales, and marketing communications. Presented as a series of case studies, this highly visual guide presents problems and solutions in the context of real-world scenarios. With over 250 visualizations, you’ll have access to relevant examples that serve as a starting point to your implementations. • Expand the boundaries of data visualization conventions and learn new approaches to traditional charts and graphs • Optimize data communications that cater to you and your audience • Provide clarity to maximize understanding • Solve data presentation problems using efficient visualization techniques • Use the provided companion website to follow along with examples The companion website gives you the illustration files and the source data sets, and points you to the types of resources you need to get started.

Related Products