logo

EbookBell.com

Most ebook files are in PDF format, so you can easily read them using various software such as Foxit Reader or directly on the Google Chrome browser.
Some ebook files are released by publishers in other formats such as .awz, .mobi, .epub, .fb2, etc. You may need to install specific software to read these formats on mobile/PC, such as Calibre.

Please read the tutorial at this link:  https://ebookbell.com/faq 


We offer FREE conversion to the popular formats you request; however, this may take some time. Therefore, right after payment, please email us, and we will try to provide the service as quickly as possible.


For some exceptional file formats or broken links (if any), please refrain from opening any disputes. Instead, email us first, and we will try to assist within a maximum of 6 hours.

EbookBell Team
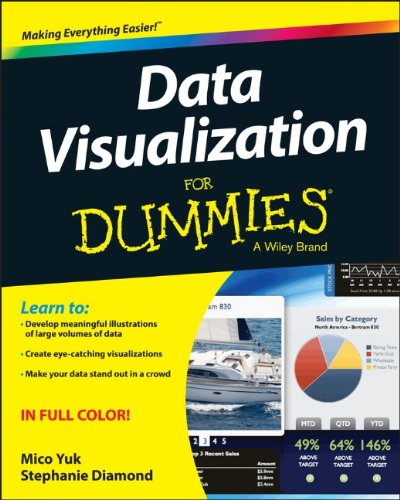
Data Visualization For Dummies 1st Edition Mico Yuk Stephanie Diamond

  • SKU: BELL-4676772
Data Visualization For Dummies 1st Edition Mico Yuk Stephanie Diamond
$ 31.00 $ 45.00 (-31%)

4.8

94 reviews

Data Visualization For Dummies 1st Edition Mico Yuk Stephanie Diamond instant download after payment.

Publisher: For Dummies
File Extension: EPUB
File size: 8.06 MB
Pages: 256
Author: Mico Yuk, Stephanie Diamond
ISBN: 9781118502891, 1118502892
Language: English
Year: 2014
Edition: 1

Product desciption

Data Visualization For Dummies 1st Edition Mico Yuk Stephanie Diamond by Mico Yuk, Stephanie Diamond 9781118502891, 1118502892 instant download after payment.

Learn meaningful ways to show trending and relationships, how to convey complex data in a clear, concise diagram, ways to create eye-catching visualizations, and much more!
- Effective data analysis involves learning how to synthesize data, especially big data, into a story and present that story in a way that resonates with the audience
- This full-color guide shows you how to analyze large amounts of data, communicate complex data in a meaningful way, and quickly slice data into various views
- Explains how to automate redundant reporting and analyses, create eye-catching visualizations, and use statistical graphics and thematic cartography
- Enables you to present vast amounts of data in ways that wont overwhelm your audience

Related Products