Most ebook files are in PDF format, so you can easily read them using various software such as Foxit Reader or directly on the Google Chrome browser.
Some ebook files are released by publishers in other formats such as .awz, .mobi, .epub, .fb2, etc. You may need to install specific software to read these formats on mobile/PC, such as Calibre.
Please read the tutorial at this link: https://ebookbell.com/faq
We offer FREE conversion to the popular formats you request; however, this may take some time. Therefore, right after payment, please email us, and we will try to provide the service as quickly as possible.
For some exceptional file formats or broken links (if any), please refrain from opening any disputes. Instead, email us first, and we will try to assist within a maximum of 6 hours.
EbookBell Team
4.7
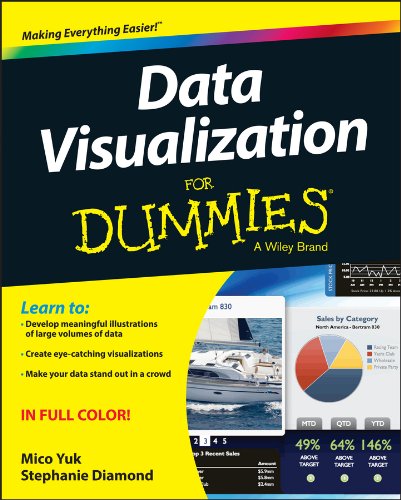
16 reviewsA straightforward, full-color guide to showcasing data so your audience can see what you mean, not just read about it
Big data is big news! Every company, industry, not-for-profit, and government agency wants and needs to analyze and leverage datasets that can quickly become ponderously large. Data visualization software enables different industries to present information in ways that are memorable and relevant to their mission. This full-color guide introduces you to a variety of ways to handle and synthesize data in much more interesting ways than mere columns and rows of numbers.
Learn meaningful ways to show trending and relationships, how to convey complex data in a clear, concise diagram, ways to create eye-catching visualizations, and much more!
Part technical manual and part analytical guidebook, Data Visualization For Dummies is the perfect tool for transforming dull tables and charts into high-impact visuals your audience will notice...and remember.