logo

EbookBell.com

Most ebook files are in PDF format, so you can easily read them using various software such as Foxit Reader or directly on the Google Chrome browser.
Some ebook files are released by publishers in other formats such as .awz, .mobi, .epub, .fb2, etc. You may need to install specific software to read these formats on mobile/PC, such as Calibre.

Please read the tutorial at this link:  https://ebookbell.com/faq 


We offer FREE conversion to the popular formats you request; however, this may take some time. Therefore, right after payment, please email us, and we will try to provide the service as quickly as possible.


For some exceptional file formats or broken links (if any), please refrain from opening any disputes. Instead, email us first, and we will try to assist within a maximum of 6 hours.

EbookBell Team
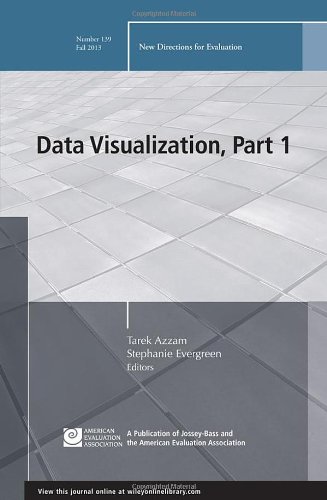
Data Visualization Part 1 New Directions For Evaluation Number 139 1st Edition Tarek Azzam

  • SKU: BELL-4743252
Data Visualization Part 1 New Directions For Evaluation Number 139 1st Edition Tarek Azzam
$ 31.00 $ 45.00 (-31%)

4.8

34 reviews

Data Visualization Part 1 New Directions For Evaluation Number 139 1st Edition Tarek Azzam instant download after payment.

Publisher: Jossey-Bass
File Extension: PDF
File size: 2.12 MB
Pages: 96
Author: Tarek Azzam, Stephanie Evergreen
ISBN: 9781118793411, 1118793412
Language: English
Year: 2013
Edition: 1

Product desciption

Data Visualization Part 1 New Directions For Evaluation Number 139 1st Edition Tarek Azzam by Tarek Azzam, Stephanie Evergreen 9781118793411, 1118793412 instant download after payment.

Do you communicate data and information to stakeholders? This issue is Part 1 of a two-part series on data visualization and evaluation. In Part 1, we introduce recent developments in the quantitative and qualitative data visualization field and provide a historical perspective on data visualization, its potential role in evaluation practice, and future directions. It discusses:
  • Quantitative visualization methods such as tree maps
  • Sparklines
  • Web-based interactive visualization
  • Different types of qualitative data visualizations, along
    with examples in various evaluation contexts
  • A toolography describing additional data visualization tools
    and software, along with their major strengths and limitations.

Intended as a guidance for understanding and designing data visualizations, this issue introduces fundamental concepts and links them to daily practice.
This is the 139th volume of the Jossey-Bass quarterly report series New Directions for Evaluation, an official publication of the American Evaluation Association.

Related Products