logo

EbookBell.com

Most ebook files are in PDF format, so you can easily read them using various software such as Foxit Reader or directly on the Google Chrome browser.
Some ebook files are released by publishers in other formats such as .awz, .mobi, .epub, .fb2, etc. You may need to install specific software to read these formats on mobile/PC, such as Calibre.

Please read the tutorial at this link:  https://ebookbell.com/faq 


We offer FREE conversion to the popular formats you request; however, this may take some time. Therefore, right after payment, please email us, and we will try to provide the service as quickly as possible.


For some exceptional file formats or broken links (if any), please refrain from opening any disputes. Instead, email us first, and we will try to assist within a maximum of 6 hours.

EbookBell Team
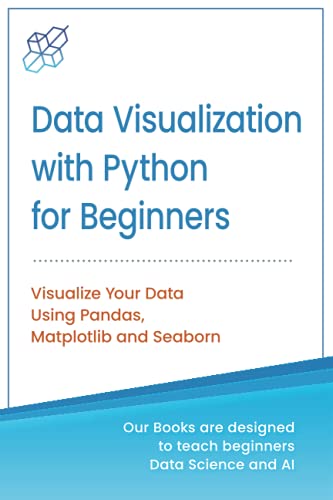
Data Visualization With Python For Beginners Visualize Your Data Using Pandas Matplotlib And Seaborn Ai Publishing

  • SKU: BELL-49605372
Data Visualization With Python For Beginners Visualize Your Data Using Pandas Matplotlib And Seaborn Ai Publishing
$ 31.00 $ 45.00 (-31%)

4.8

94 reviews

Data Visualization With Python For Beginners Visualize Your Data Using Pandas Matplotlib And Seaborn Ai Publishing instant download after payment.

Publisher: AI Publishing LLC
File Extension: PDF
File size: 7.33 MB
Pages: 280
Author: Ai Publishing
ISBN: 9781733042680, 1733042687
Language: English
Year: 2020

Product desciption

Data Visualization With Python For Beginners Visualize Your Data Using Pandas Matplotlib And Seaborn Ai Publishing by Ai Publishing 9781733042680, 1733042687 instant download after payment.

Data Visualization using Python for Beginners Are you looking for a hands-on approach to learn Python for Data Visualization Fast? Do you need to start learning Python for Data Visualization from Scratch? This book is for you. This book works as guide to present fundamental Python Libraries and basis related to Data Visualization using Python. Data science and data visualization are two different but interrelated concepts. Data science refers to the science of extracting and exploring data in order to find patterns that can be used for decision making at different levels. Data visualization can be considered as a subdomain of data science where you visualize data with the help of graphs and tables in order to find out which data is most significant and can help in the identification of important patterns. This book is dedicated to data visualization and explains how to perform data visualization on a variety of datasets using various data visualization libraries written in the Python programming language. It is suggested that you use this book for data visualization purposes only and not for decision making. For decision making and pattern identification, read this book in conjunction with a dedicated book on machine learning and data science. We will start by digging into Python programming as all the projects are developed using it, and it is currently the most used programming language in the world. We will also explore the most-famous libraries for Data Visualization such as Pandas, Numpy, Matplotlib, Seaborn, etc . What this book offers... You will learn all about python in three modules, one for Plotting with Matplotlib, one for Plotting with Seaborn, and a final one Pandas for Data Visualization. All three modules will contain hands-on projects using real-world datasets and a lot of exercises. Clear and Easy to Understand Solutions All solutions in this book are extensively tested by a group of beta readers. 

Related Products