logo

EbookBell.com

Most ebook files are in PDF format, so you can easily read them using various software such as Foxit Reader or directly on the Google Chrome browser.
Some ebook files are released by publishers in other formats such as .awz, .mobi, .epub, .fb2, etc. You may need to install specific software to read these formats on mobile/PC, such as Calibre.

Please read the tutorial at this link:  https://ebookbell.com/faq 


We offer FREE conversion to the popular formats you request; however, this may take some time. Therefore, right after payment, please email us, and we will try to provide the service as quickly as possible.


For some exceptional file formats or broken links (if any), please refrain from opening any disputes. Instead, email us first, and we will try to assist within a maximum of 6 hours.

EbookBell Team
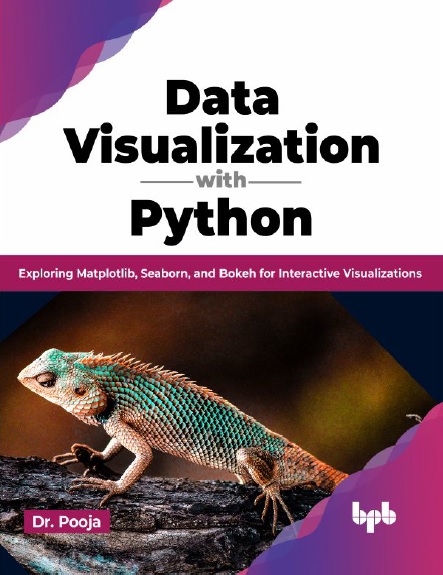
Data Visualization With Python Exploring Matplotlib Seaborn And Bokeh For Interactive Visualizations Dr Pooja

  • SKU: BELL-53640492
Data Visualization With Python Exploring Matplotlib Seaborn And Bokeh For Interactive Visualizations Dr Pooja
$ 31.00 $ 45.00 (-31%)

4.8

54 reviews

Data Visualization With Python Exploring Matplotlib Seaborn And Bokeh For Interactive Visualizations Dr Pooja instant download after payment.

Publisher: BPB Online
File Extension: EPUB
File size: 6.51 MB
Pages: 304
Author: Dr. Pooja
ISBN: 9789355515384, 9355515383
Language: English
Year: 2023

Product desciption

Data Visualization With Python Exploring Matplotlib Seaborn And Bokeh For Interactive Visualizations Dr Pooja by Dr. Pooja 9789355515384, 9355515383 instant download after payment.

Transforming data into actionable insights using Python Key Features ● Gain a comprehensive understanding of data visualization and exploratory data analysis (EDA) using Python. ● Discover valuable insights and patterns in data through visual analysis. ● Master the art of effectively communicating complex concepts by creating compelling and impactful data visualizations. Description Python is a popular programming language for data visualization due to its rich ecosystem of libraries and tools. If you're interested in delving into data visualization in Python, this book is an excellent resource to begin your journey. With Matplotlib, you'll master the art of creating a wide range of charts, plots, and graphs. From basic line plots to complex 3D visualizations, you'll learn how to transform raw data into engaging visuals that tell compelling stories. Dive into Seaborn, a high-level library built on top of Matplotlib, and discover how to effortlessly create beautiful and informative statistical visualizations effortlessly. From heatmaps to distribution plots, you'll unleash the full potential of Seaborn in your data analysis endeavors. Lastly, you will learn how to unleash the true potential of Bokeh and create compelling data visualizations that allow users to explore and interact with data dynamically. By the end of the book, you will have acquired the knowledge and skills necessary to create a diverse range of visualizations proficiently. What you will learn ● Utilize Matplotlib, Seaborn, and Bokeh to produce visually captivating visualizations. ● Gain expertise in various types of charts, plots, and graphs. ● Craft visually appealing and informative statistical visualizations. ● Construct interactive and adaptable plots using Bokeh. ● Explore various techniques for conducting Exploratory Data Analysis (EDA). Who this book is for This book caters to a wide audience, including undergraduate and postgraduate students, researchers, data managers, and data analysts.…

Related Products